> ## Documentation Index
> Fetch the complete documentation index at: https://herd.laravel.com/docs/llms.txt
> Use this file to discover all available pages before exploring further.
# Insights
# Debugging with Insights
Insights shows you what your application does on every request. While Herd captures the runtime context of your sites, it collects all `dump()` calls, queries, logs, dispatched jobs, outgoing HTTP requests and cache events, and displays them in the Insights window instead of rendering them in the browser or CLI. Your coding agents can read the same information via the Herd CLI and MCP server, so they can debug your application without asking you to copy and paste anything.
## Using Insights
You may open the Insights window via the Herd menu bar icon, the "Insights" button in the toolbar of the [Applications window](/docs/macos/sites/managing-sites) or a global shortcut that you can define in the [shortcut settings](/docs/macos/advanced-usage/shortcuts).
To start capturing, click the antenna icon in the toolbar of the Insights window. The icon pulses while Herd captures runtime context. You can also turn it on with the "Give agents runtime context" switch in the AI tab of the settings, the "Toggle Runtime Context" shortcut or the `herd insights:capture on` command.
Once enabled, you may use the `dump()` function as usual. Instead of printing the dump to your browser or terminal, Herd sends it to the Insights window. If you want to see the output of `dump()` in your page or terminal as well, turn on "`dump()` output in the page and terminal" in the settings of the Insights window. `dd()` always shows in both places.
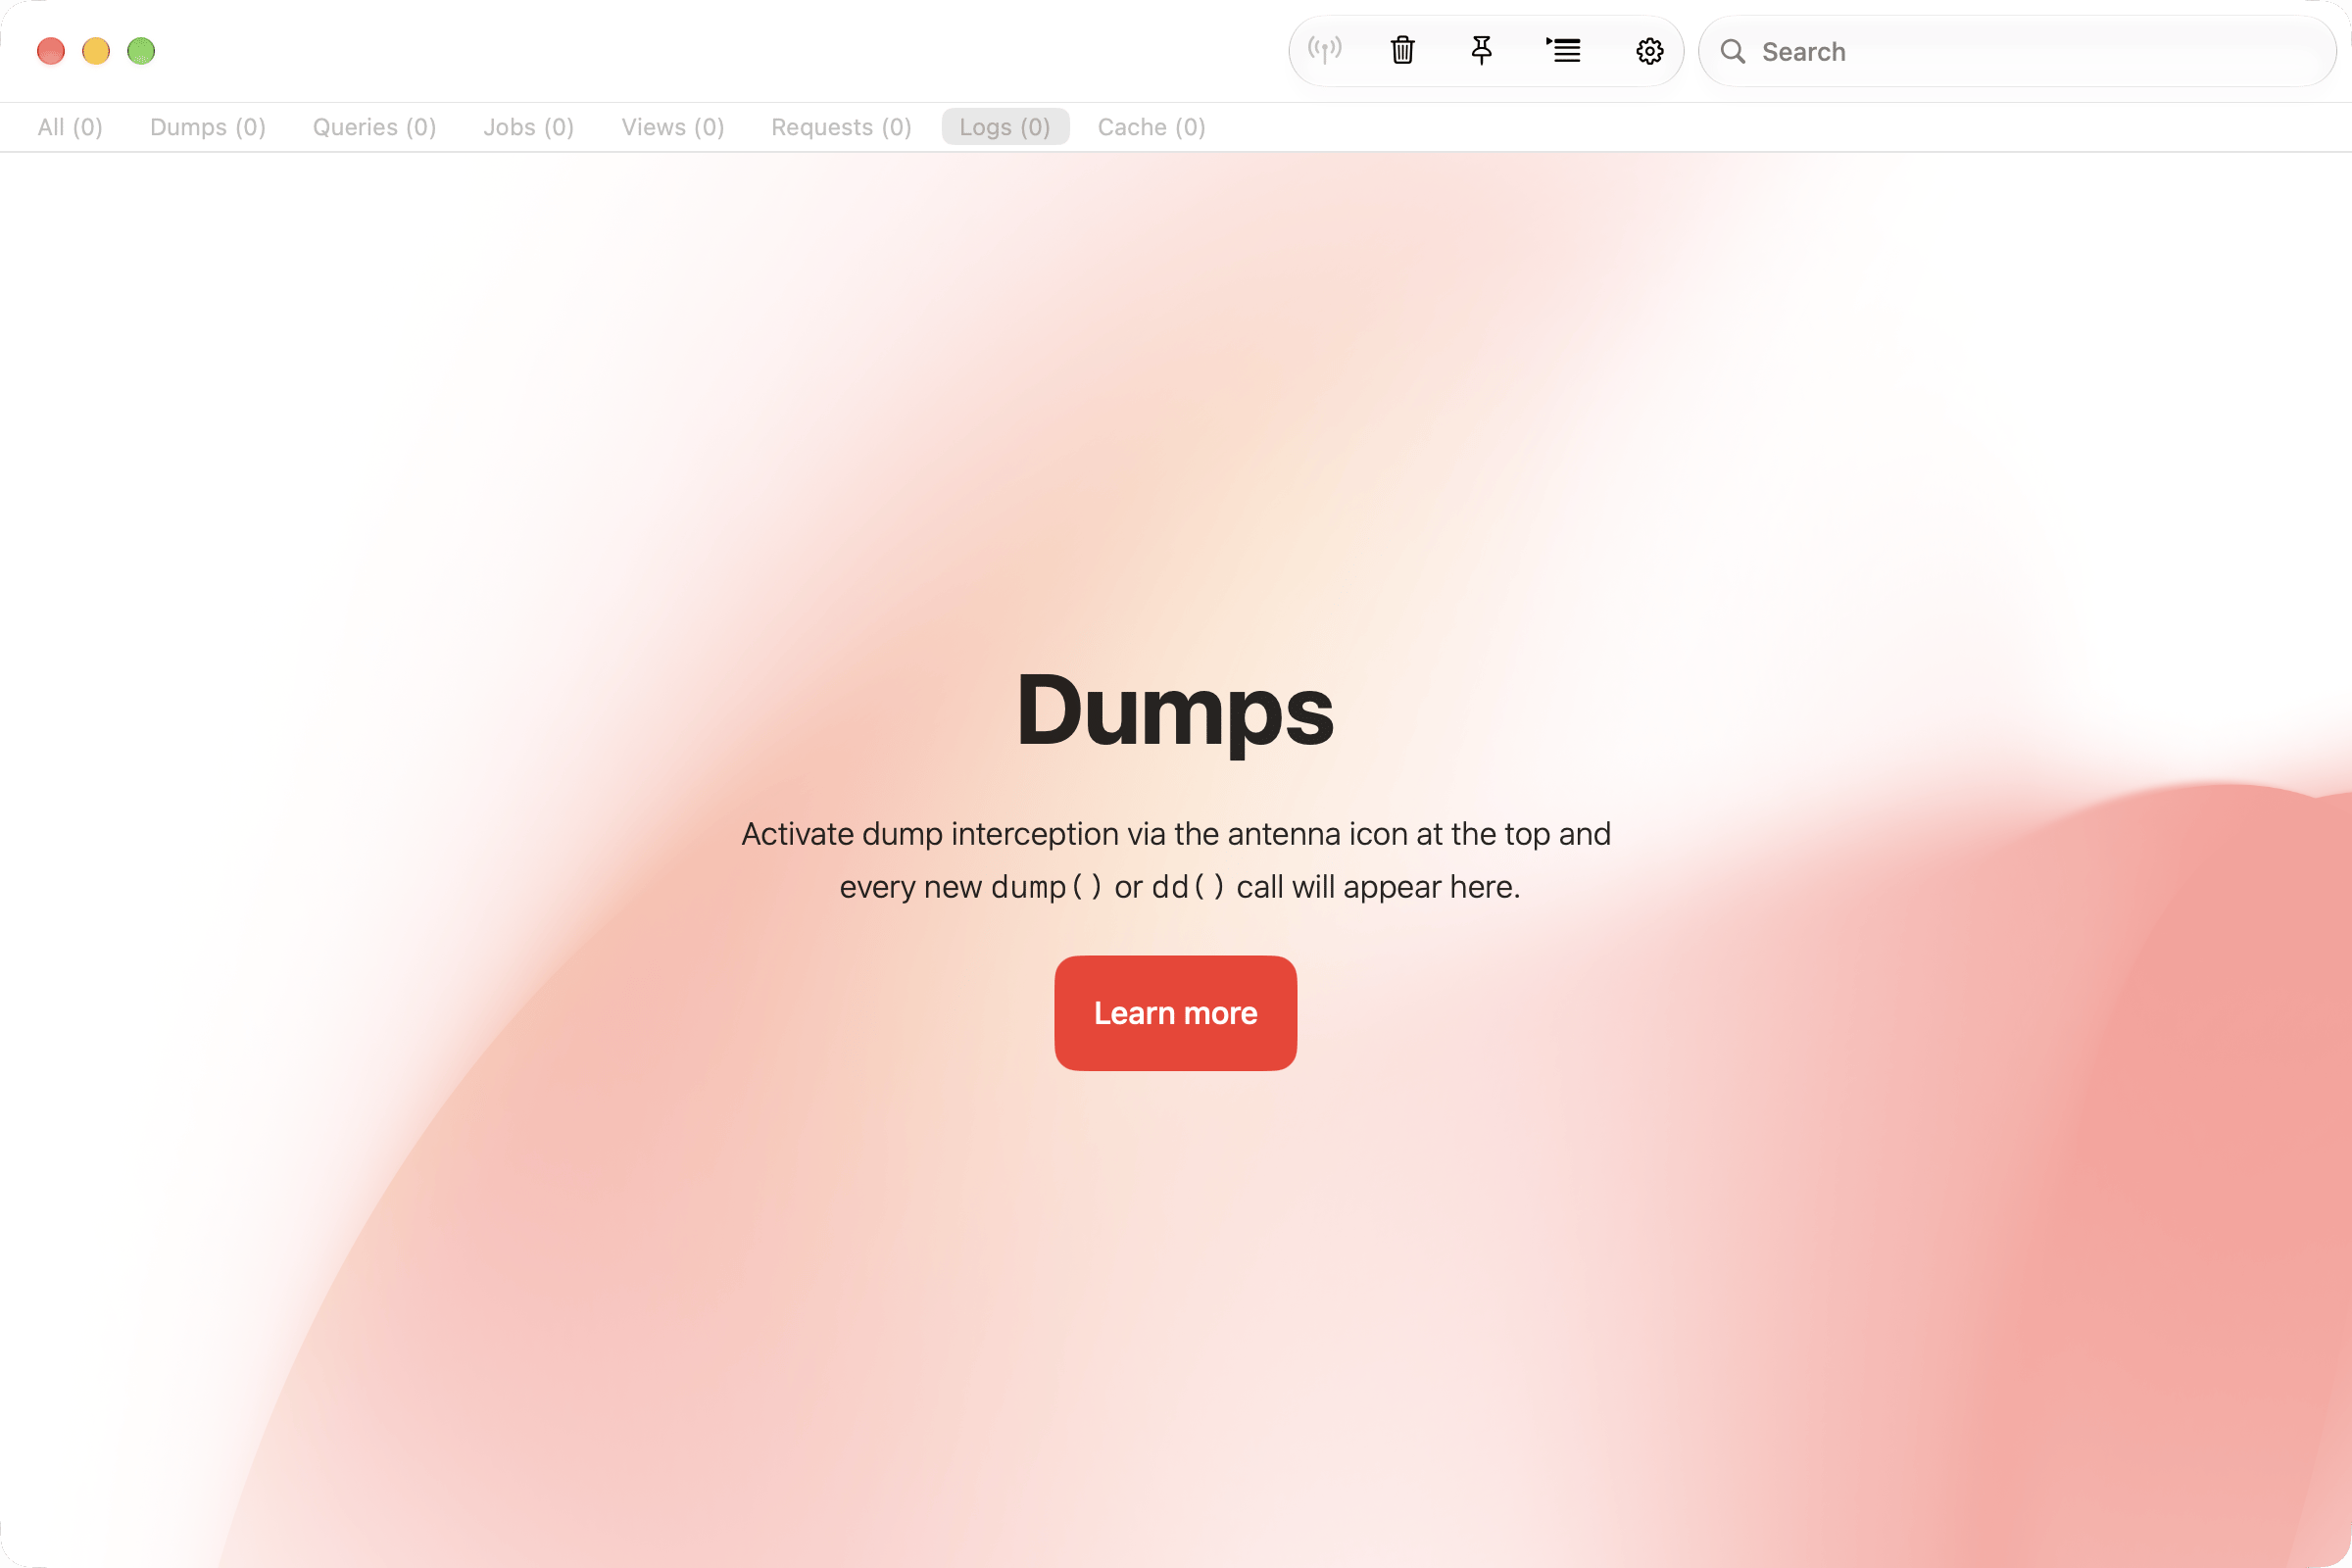 New entries are automatically added to the window, and you can clear the window with the trash icon in the toolbar. All entries are searchable so you can easily find what you are looking for.
By default, every new request clears the window. Turn on "Keep entries from earlier requests" in the settings of the window to keep a history. Herd keeps the entries of every site separately for your coding agents, regardless of this setting. You can also see them in the Insights tab of [Herd Studio](/docs/macos/herd-studio/overview).
Herd captures page loads and queue jobs. Artisan commands and other PHP scripts are only captured if you turn on "Include `php` CLI commands" below the runtime context switch in the AI tab of the settings. Herd never captures test runs.
## Settings
Click the gear icon in the toolbar of the Insights window to choose which entries the window shows. These options only filter the window – Herd still captures everything, and your coding agents always see all entries.
New entries are automatically added to the window, and you can clear the window with the trash icon in the toolbar. All entries are searchable so you can easily find what you are looking for.
By default, every new request clears the window. Turn on "Keep entries from earlier requests" in the settings of the window to keep a history. Herd keeps the entries of every site separately for your coding agents, regardless of this setting. You can also see them in the Insights tab of [Herd Studio](/docs/macos/herd-studio/overview).
Herd captures page loads and queue jobs. Artisan commands and other PHP scripts are only captured if you turn on "Include `php` CLI commands" below the runtime context switch in the AI tab of the settings. Herd never captures test runs.
## Settings
Click the gear icon in the toolbar of the Insights window to choose which entries the window shows. These options only filter the window – Herd still captures everything, and your coding agents always see all entries.
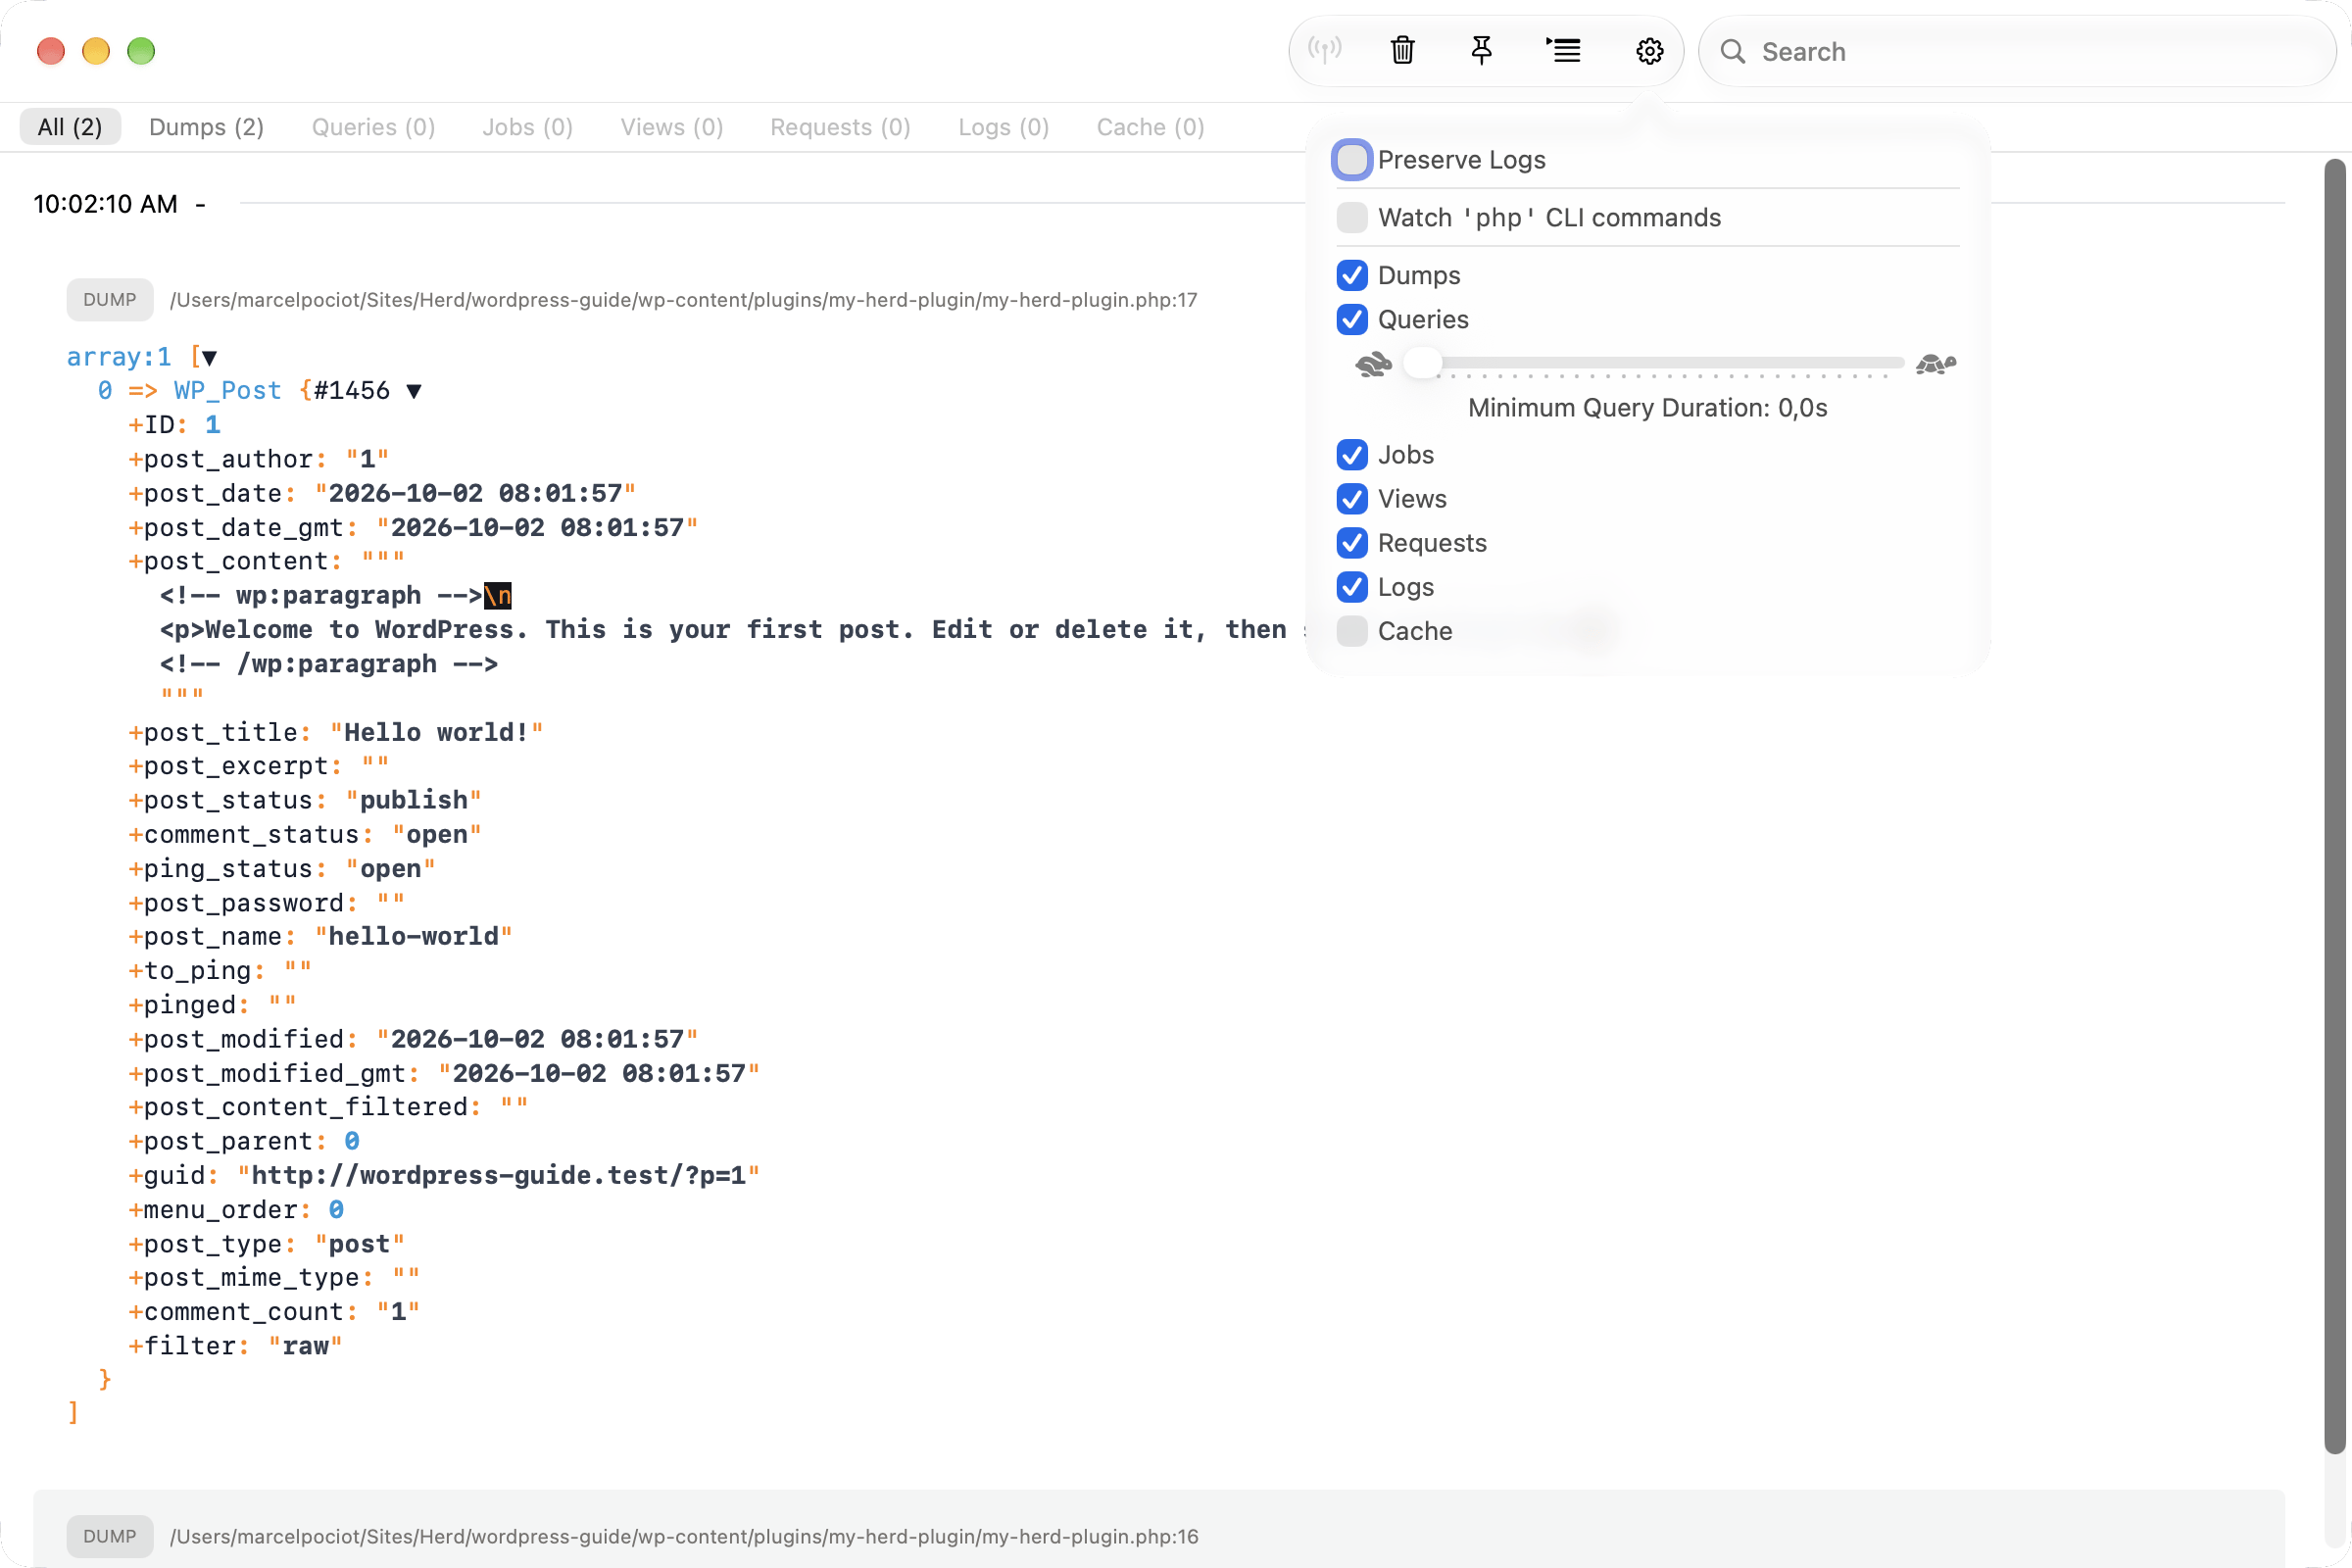 You can find the server settings of Insights in the "Herd Pro" tab of the settings.
## Dumps
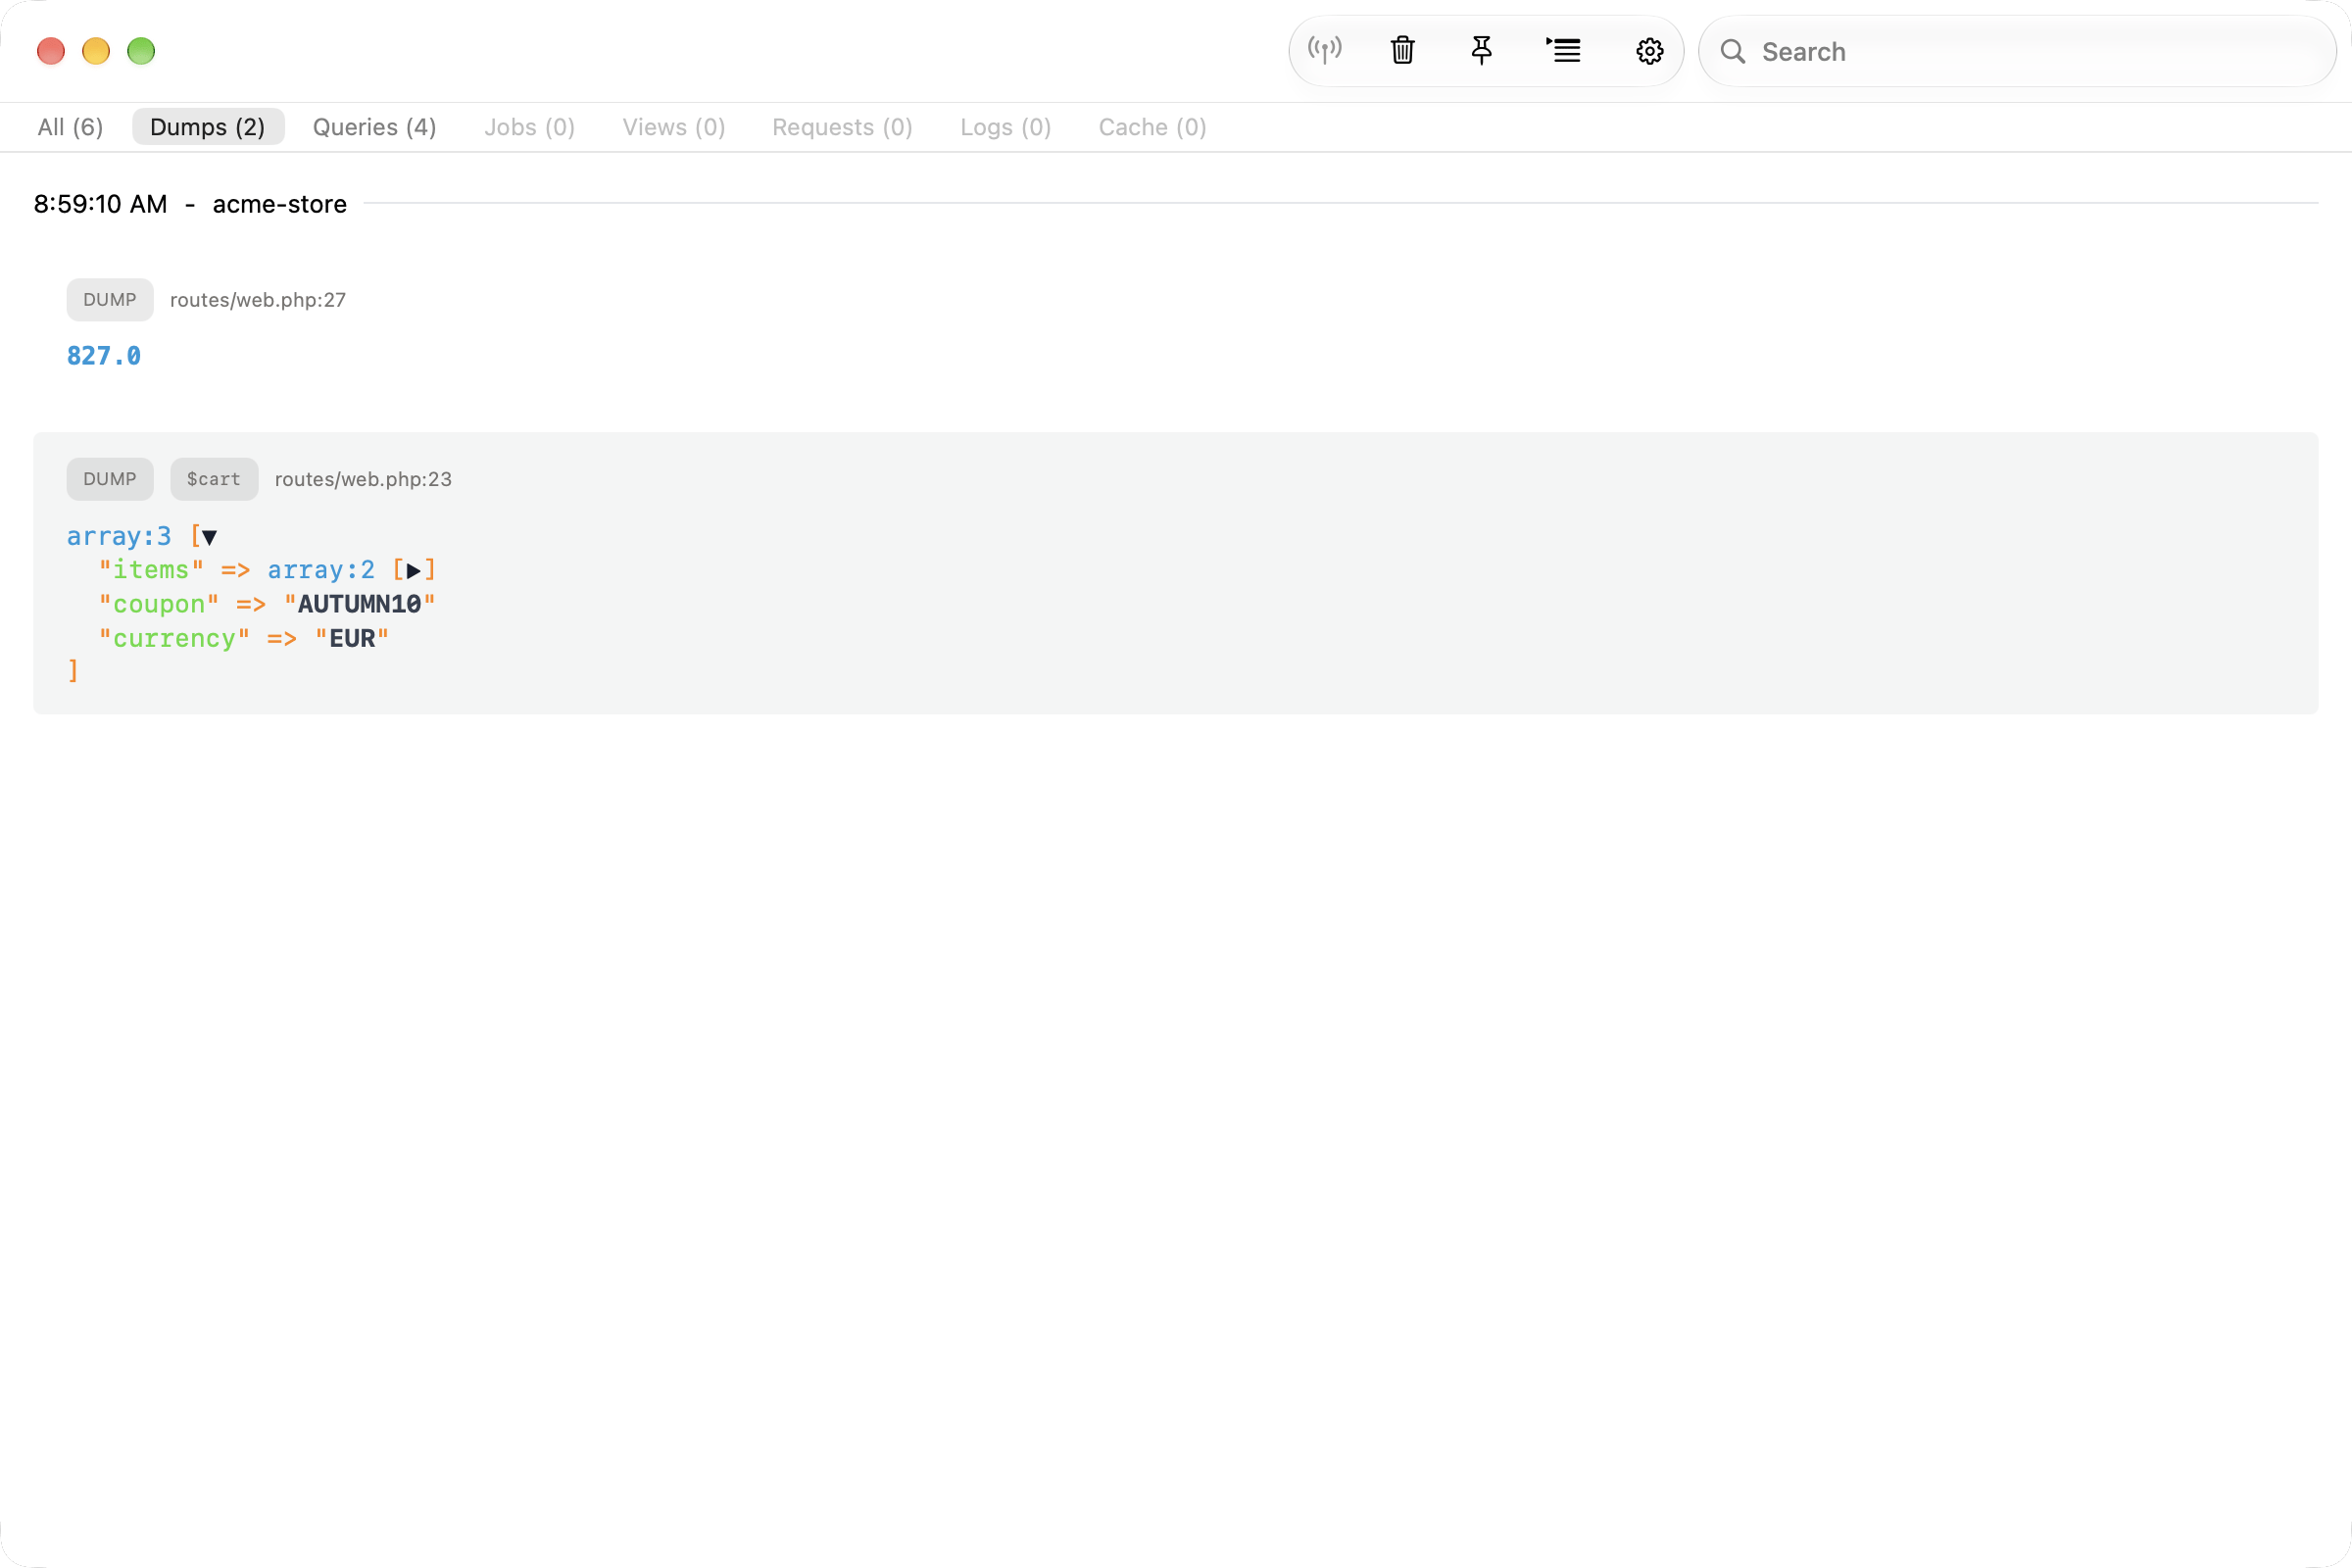
All dumps that you run via Laravels' `dump()` or `dd()` methods automatically go to the Insights window instead of your browser. This has the advantage that the dump doesn't break your layout and SPAs still work.
This also sends `dump()` calls from queued jobs to the Insights window that you wouldn't see in your browser when working with real queues.
You can find the server settings of Insights in the "Herd Pro" tab of the settings.
## Dumps
All dumps that you run via Laravels' `dump()` or `dd()` methods automatically go to the Insights window instead of your browser. This has the advantage that the dump doesn't break your layout and SPAs still work.
This also sends `dump()` calls from queued jobs to the Insights window that you wouldn't see in your browser when working with real queues.
 ## Queries
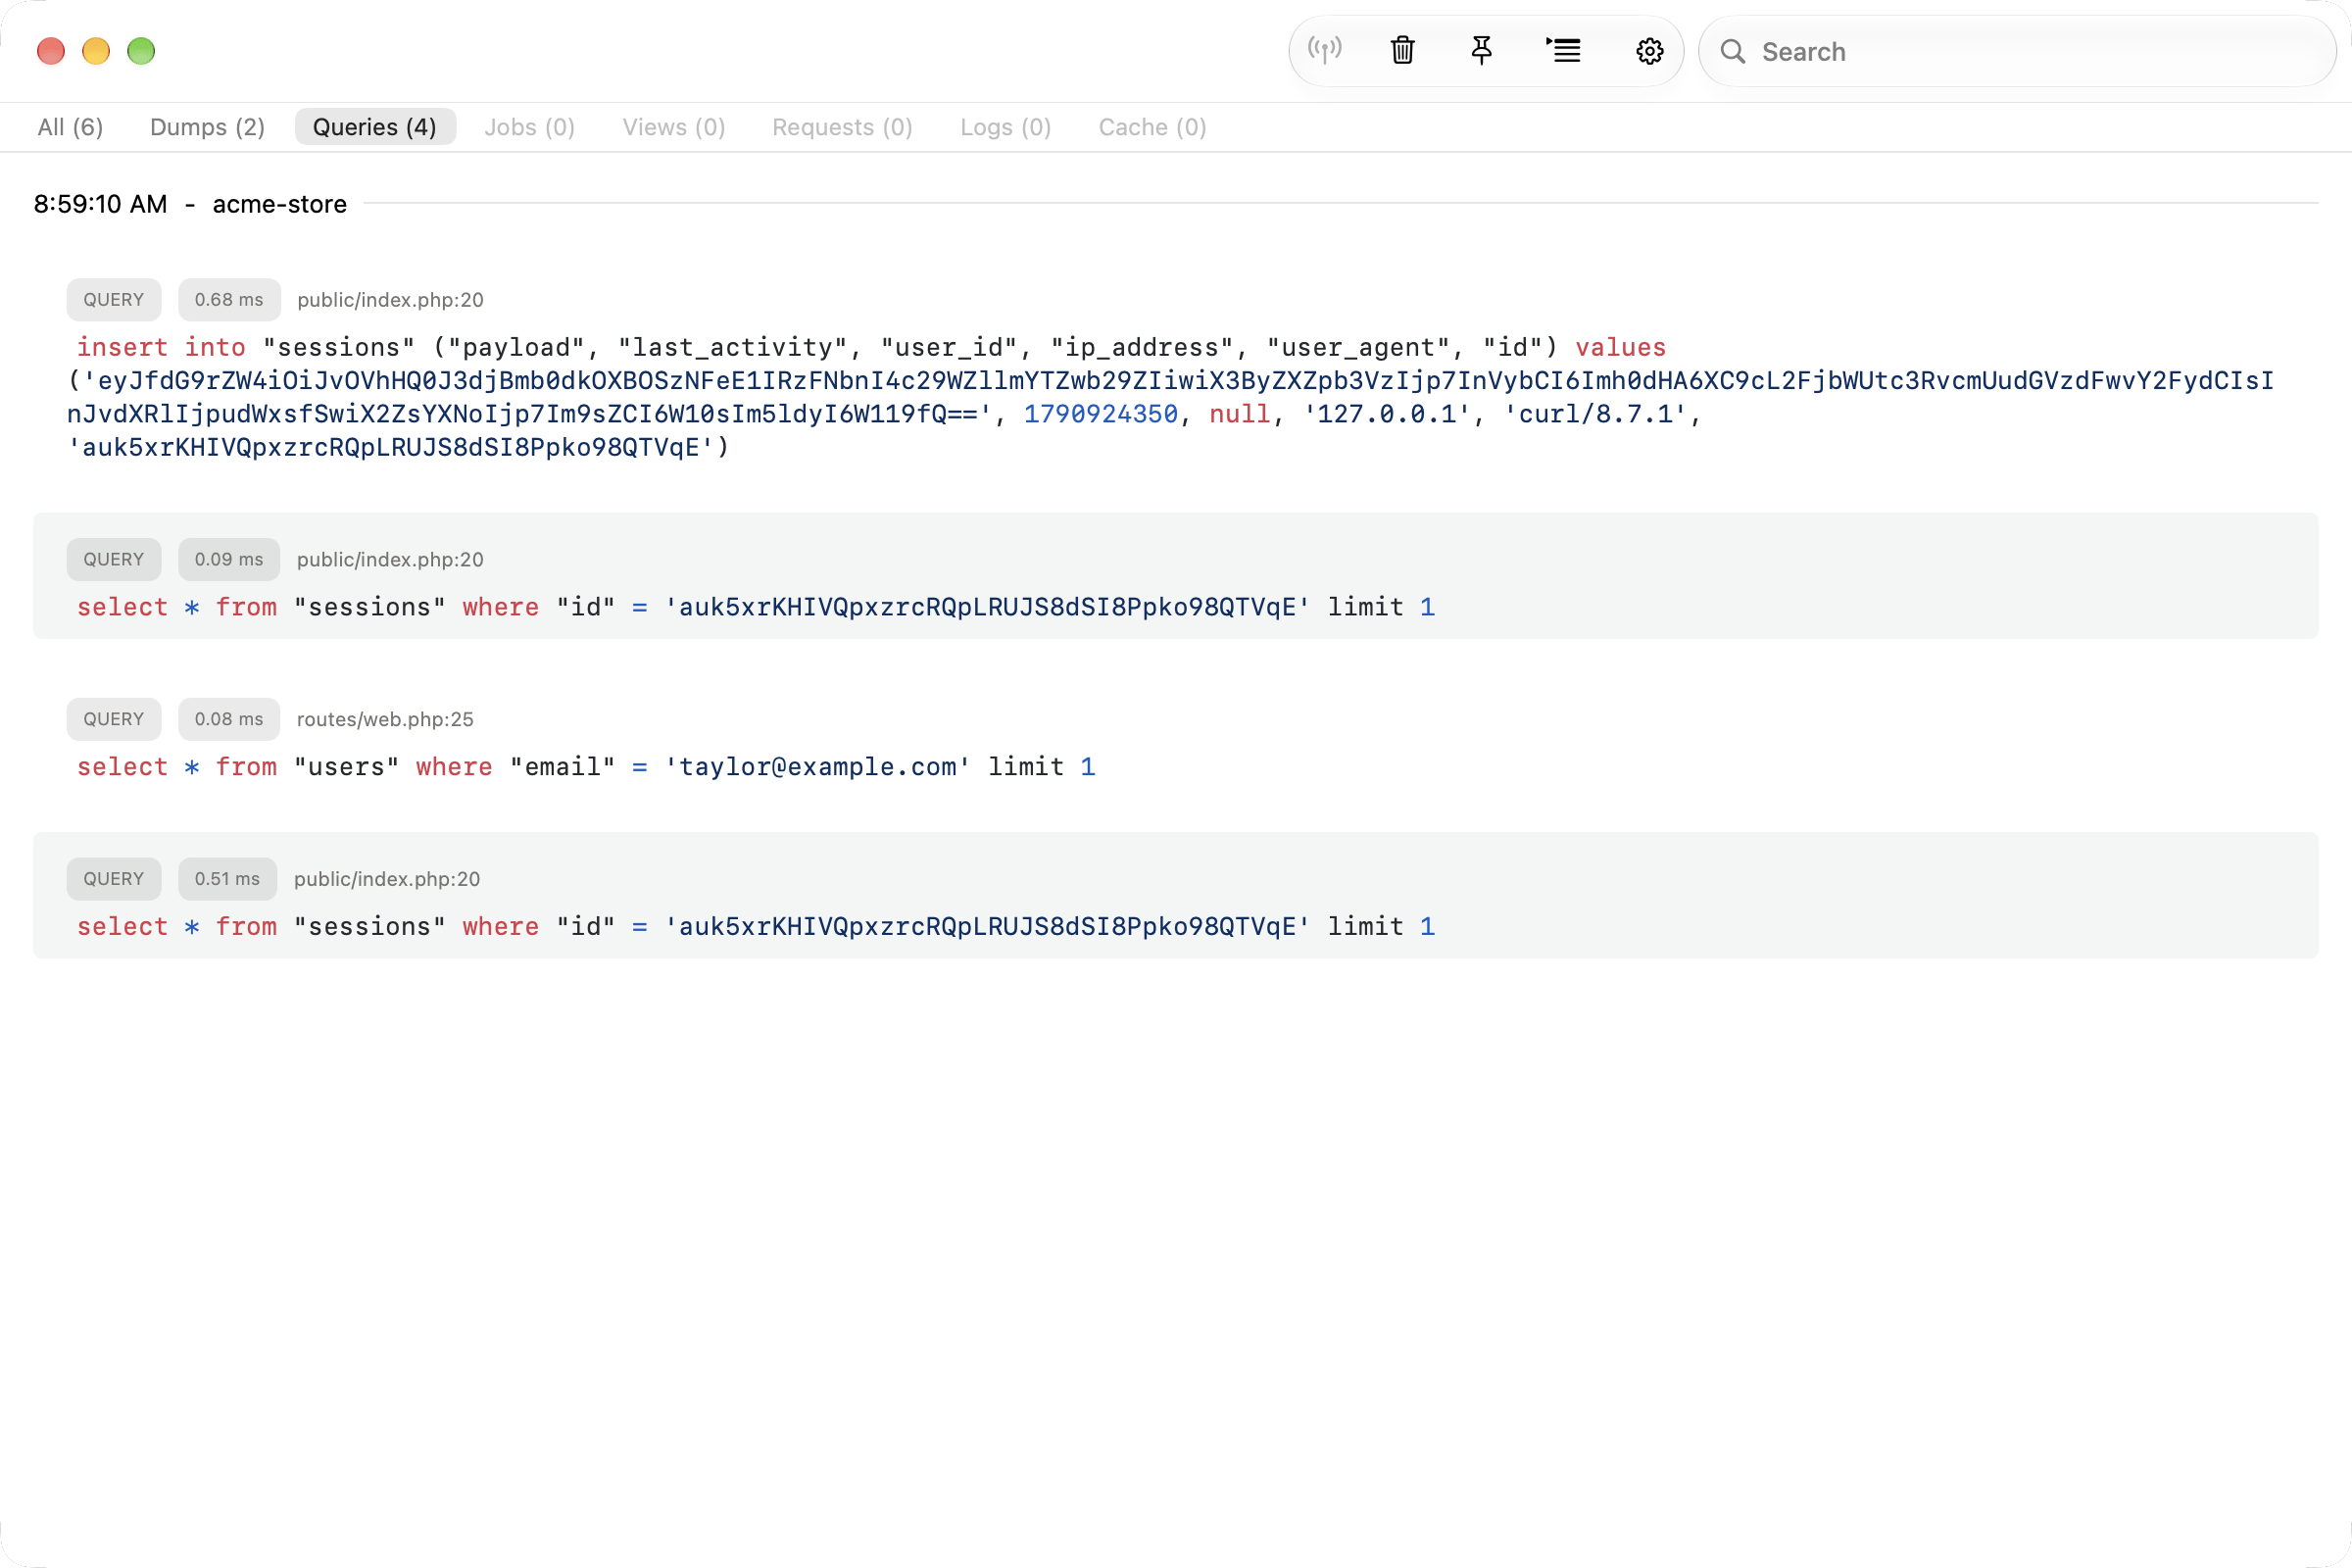
The "Queries" tab lists all queries that your application executes. If you only want to debug slow queries, you can hide fast queries with the minimum query duration in the settings of the window.
## Queries
The "Queries" tab lists all queries that your application executes. If you only want to debug slow queries, you can hide fast queries with the minimum query duration in the settings of the window.
 ## Jobs
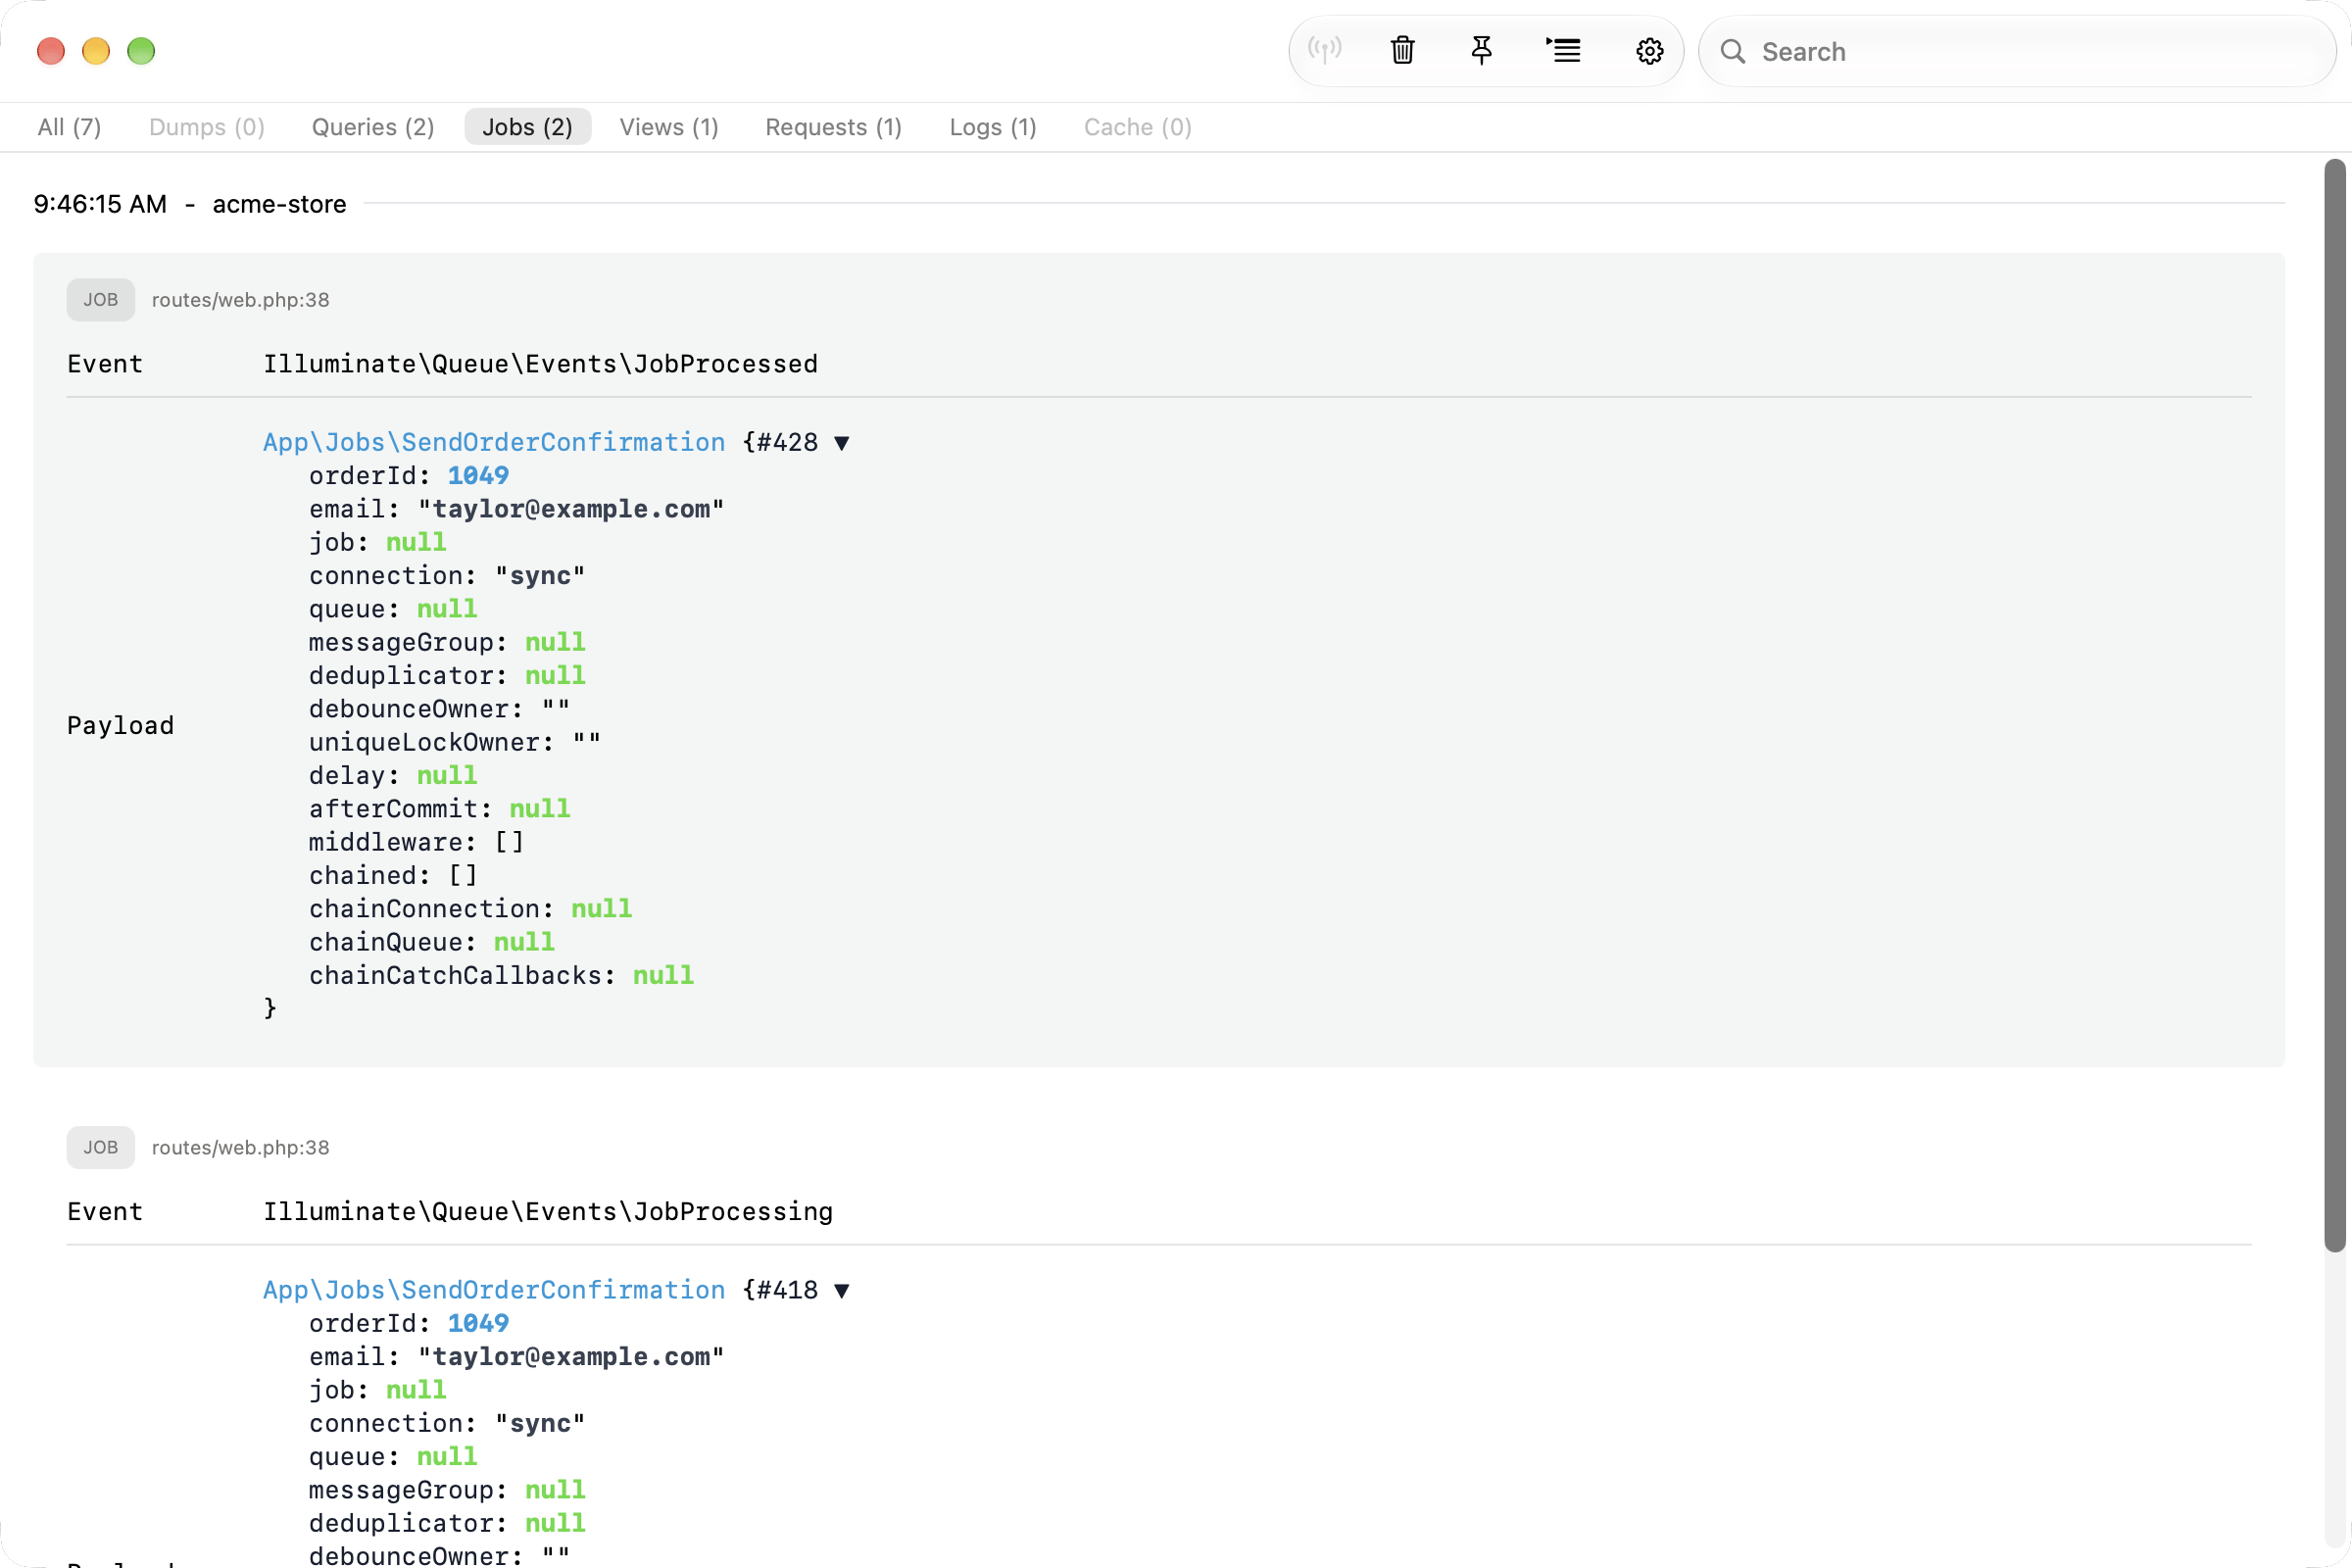
The "Jobs" tab lists all jobs that your application runs. This is super useful when you work with the sync driver and are not sure if all jobs are properly triggered.
## Jobs
The "Jobs" tab lists all jobs that your application runs. This is super useful when you work with the sync driver and are not sure if all jobs are properly triggered.
 ## HTTP
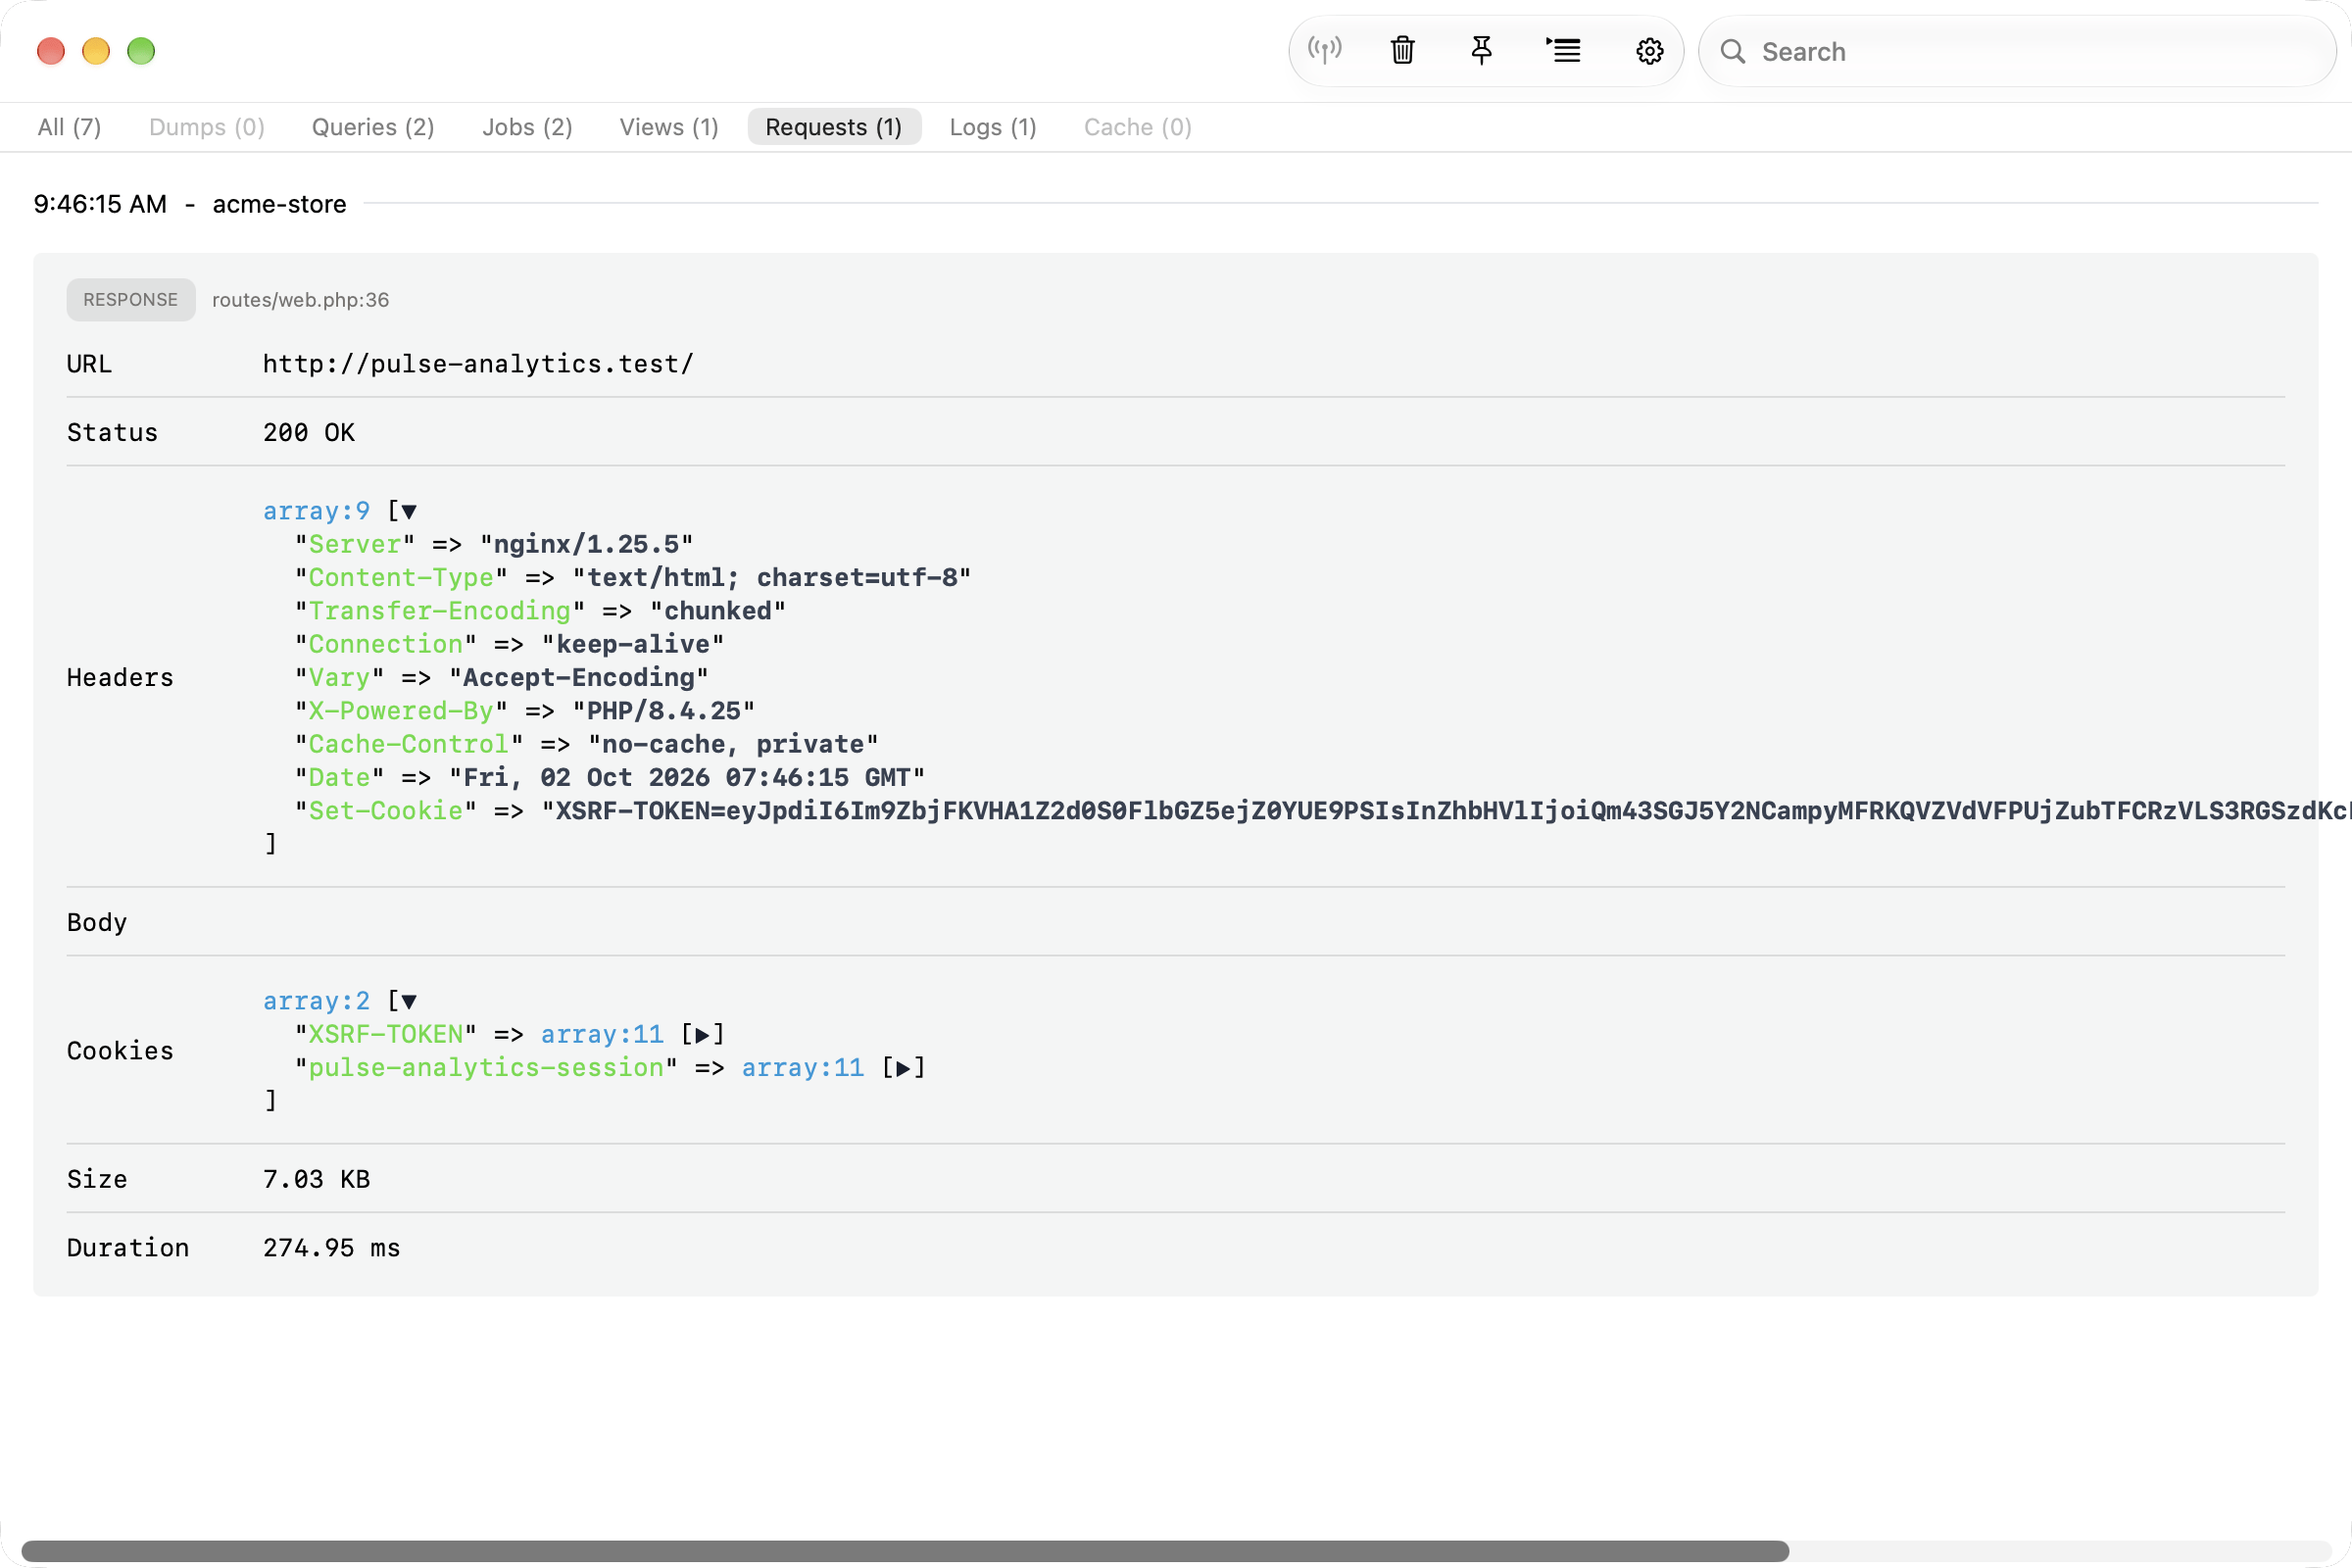
The "HTTP" tab displays all outgoing HTTP requests of your application, so if you're working with an API, these calls show up in the Insights window and allow you to inspect them without searching through logs etc.
## HTTP
The "HTTP" tab displays all outgoing HTTP requests of your application, so if you're working with an API, these calls show up in the Insights window and allow you to inspect them without searching through logs etc.
 ## Logs
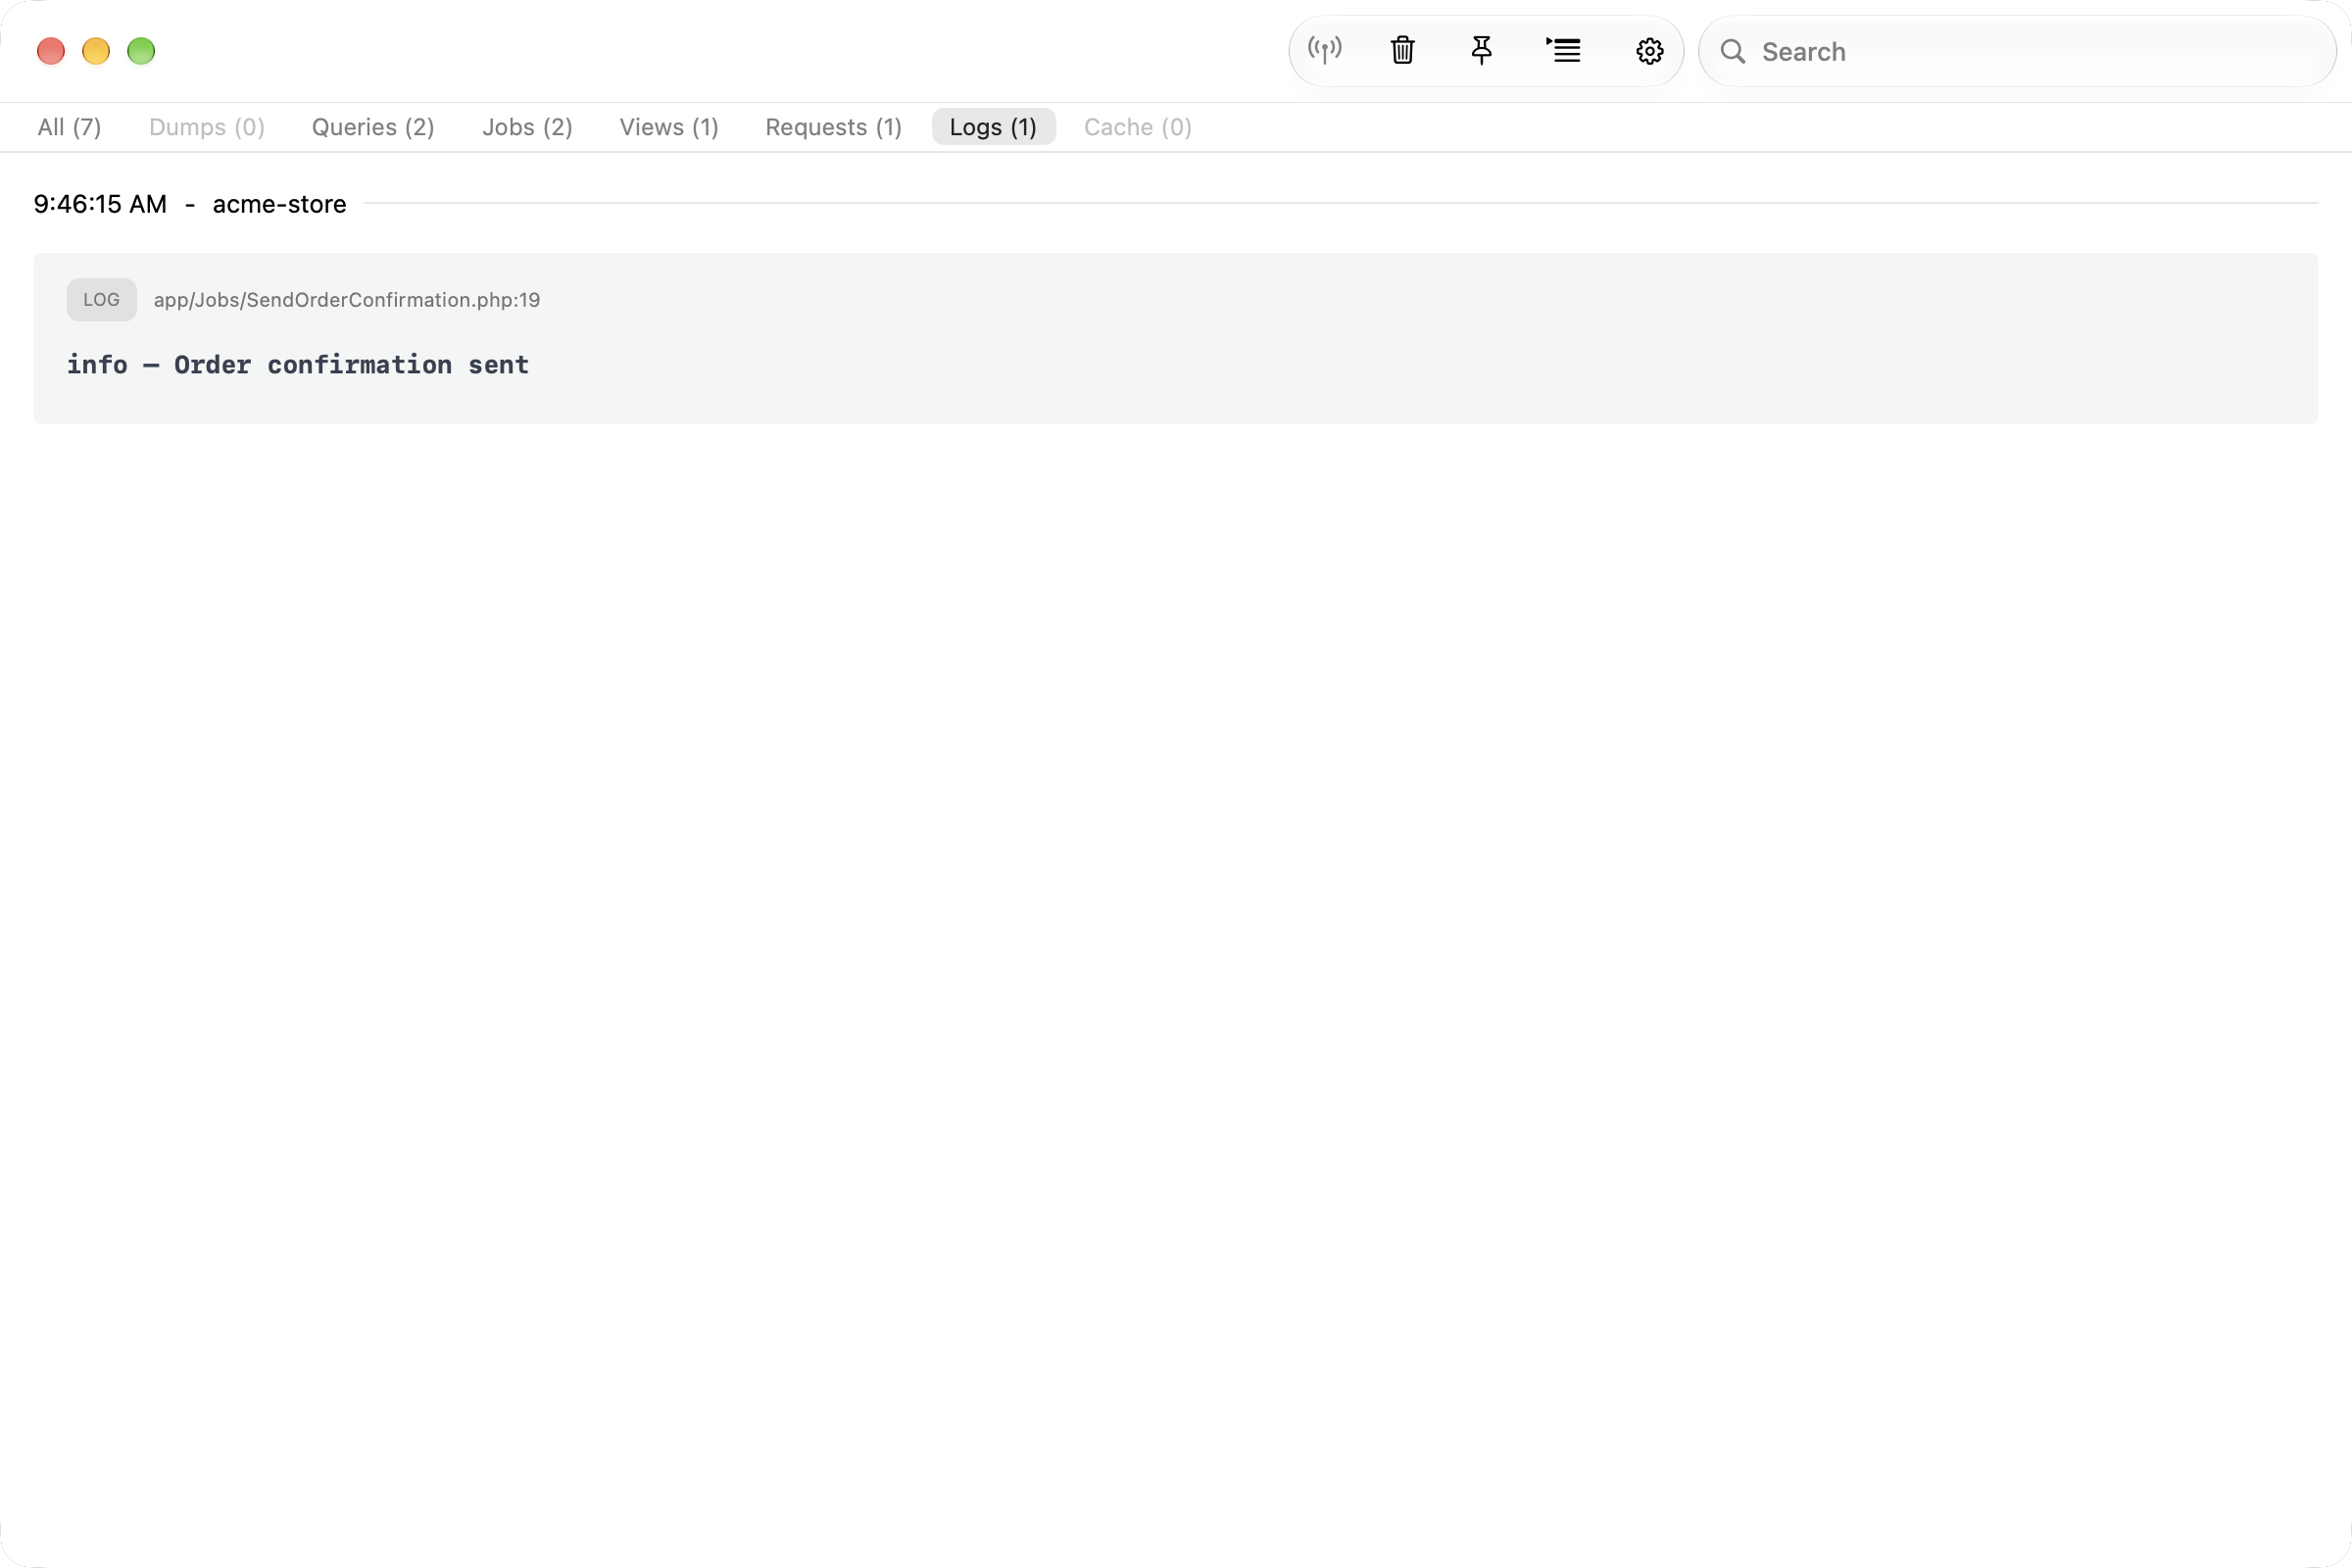
You can get all logs of a request without using Herd's Log Viewer or digging through log files.
## Logs
You can get all logs of a request without using Herd's Log Viewer or digging through log files.
 ## Cache
The "Cache" tab shows the cache hits, misses, writes and deletions of a request.
## Finding problems
Herd analyzes every request, job and command that it captures and finds common problems, together with the file and line that caused them and a hint how to fix them:
* N+1 queries
* Duplicate queries
* Slow queries, by default 100 ms or slower
* Errors like HTTP 500 responses, failed jobs and logged errors
* Slow requests, by default 1 second or slower
Run `herd insights:analyze` in your project directory to see these problems, or let your coding agent run it. To verify a fix, load the page again and run the command with the `--after` option and the cursor that the previous run printed.
```bash theme={null}
herd insights:analyze
herd insights:analyze --after=CURSOR
```
You can change the thresholds in the `insights` section of the `~/Library/Application Support/Herd/config/herd.json` file:
```json theme={null}
"insights": {
"nPlusOneMinRepeats": 3,
"duplicateMinRepeats": 3,
"slowQueryMs": 100,
"slowRequestMs": 1000
}
```
## Insights via the CLI
You can read and watch everything that Herd captured from your terminal with the `herd insights:*` commands. This is also a great way to give AI agents access to the runtime context of your application.
```bash theme={null}
# Show the entries of the current site, grouped by request
herd insights:list
# Only show queries
herd insights:list --type=query
# Stream new entries as they arrive
herd insights:watch
# Find N+1 queries, slow queries and errors
herd insights:analyze
# Turn capturing on or off
herd insights:capture on
```
See the [CLI reference](/docs/macos/advanced-usage/herd-cli#insights-herd-pro) for all commands and options.
## Herd Pro
Insights is a Herd Pro feature. Without a license, you can try it with a free trial in which each captured request or job counts once. Once the trial is used up, Herd stops capturing until you activate [Herd Pro](https://herd.laravel.com/checkout).
## Troubleshooting
Insights uses Herds' own PHP extension so make sure it is present in your `php.ini` and the path to the extension is correct. If you think that there is a problem with the path, simply quit Herd, remove the extension from the ini file and start Herd again. This will add the extension to the configuration file with the correct path.
```ini theme={null}
extension=/Applications/Herd.app/Contents/Resources/herd-ext/herd-84-arm64.so
```
Technically, Herd uses this extension to inject code into your codebase in very early stages of the bootstrapping process. So if you're facing issues within your application, you might want to turn off runtime context with the antenna icon in the Insights window.
## Cache
The "Cache" tab shows the cache hits, misses, writes and deletions of a request.
## Finding problems
Herd analyzes every request, job and command that it captures and finds common problems, together with the file and line that caused them and a hint how to fix them:
* N+1 queries
* Duplicate queries
* Slow queries, by default 100 ms or slower
* Errors like HTTP 500 responses, failed jobs and logged errors
* Slow requests, by default 1 second or slower
Run `herd insights:analyze` in your project directory to see these problems, or let your coding agent run it. To verify a fix, load the page again and run the command with the `--after` option and the cursor that the previous run printed.
```bash theme={null}
herd insights:analyze
herd insights:analyze --after=CURSOR
```
You can change the thresholds in the `insights` section of the `~/Library/Application Support/Herd/config/herd.json` file:
```json theme={null}
"insights": {
"nPlusOneMinRepeats": 3,
"duplicateMinRepeats": 3,
"slowQueryMs": 100,
"slowRequestMs": 1000
}
```
## Insights via the CLI
You can read and watch everything that Herd captured from your terminal with the `herd insights:*` commands. This is also a great way to give AI agents access to the runtime context of your application.
```bash theme={null}
# Show the entries of the current site, grouped by request
herd insights:list
# Only show queries
herd insights:list --type=query
# Stream new entries as they arrive
herd insights:watch
# Find N+1 queries, slow queries and errors
herd insights:analyze
# Turn capturing on or off
herd insights:capture on
```
See the [CLI reference](/docs/macos/advanced-usage/herd-cli#insights-herd-pro) for all commands and options.
## Herd Pro
Insights is a Herd Pro feature. Without a license, you can try it with a free trial in which each captured request or job counts once. Once the trial is used up, Herd stops capturing until you activate [Herd Pro](https://herd.laravel.com/checkout).
## Troubleshooting
Insights uses Herds' own PHP extension so make sure it is present in your `php.ini` and the path to the extension is correct. If you think that there is a problem with the path, simply quit Herd, remove the extension from the ini file and start Herd again. This will add the extension to the configuration file with the correct path.
```ini theme={null}
extension=/Applications/Herd.app/Contents/Resources/herd-ext/herd-84-arm64.so
```
Technically, Herd uses this extension to inject code into your codebase in very early stages of the bootstrapping process. So if you're facing issues within your application, you might want to turn off runtime context with the antenna icon in the Insights window.